More on the troponin, "1 in 35" study.
A correction on the troponin measures (Note- no Day 30 troponin measures were taken), and the critical need for proper timeframes.
Tl;dr: I incorrectly assumed that troponin levels were measured on Day 30 in the Buergin, et al.1 study when in reality troponin measures were only taken on Day 3 and Day 4. Unfortunately, this actually means that fewer data points were taken. Anyways, apologies for overlooking the timing of troponin measurements. I suppose I thought that the researchers would at least have more than two data points for each person.
On Friday I commented on a “1 in 35” Swiss study which seemed to suggest that myocardial injury from the COVID vaccines may be higher than previously thought. Although a rather interesting, and damning if true argument, I didn’t find the study all too compelling, mostly because the study didn’t seem to do more to interpret its troponin findings.
Troponin levels, especially when measured with high-sensitivity assays such as the one used in the study, have become critical in diagnosing myocardial injury, and especially in predicting possible acute myocardial infarction (heart attacks). In that regard, troponin levels may be a good indicator of something wrong going on within the body.
However, because the study didn’t seem to do much outside of recognizing elevated troponin levels, and on Day 3 post booster nonetheless, it doesn’t leave anything else to work with because it doesn’t provide us insights into what these troponin levels mean, especially since no measures were taken prior to vaccination.
Consider that elevated troponin levels are not just associated with myocardial injury alone. It’s also possible that other diseases, such as renal failure and strokes are also associated with elevated troponin levels. That also includes diabetes and possibly hypertension, among other non-cardiac diseases.

Note that tachycardia is mentioned above, and has been growing in recognition as a possible example of long-term vaccine adverse reactions by way of POTS. So even if myocarditis or heart attacks are not considered, it’s important to consider other cardiac and noncardiac associations with respect to troponin levels.
Troponin levels are also elevated in those who engage in strenuous exercise. It seems that with these individuals troponin levels may relate to cellular turnover more than direct cellular damage. Age is also correlated with elevated troponin, with an interesting negative correlation between physical exercise and troponin levels among the elderly.2
Remember that the vaccine-injured group leaned older within the Buergin, et al. study, so they are likely to show more elevated troponin levels compared to the other groups in general.
All this to say that troponin levels alone may not tell us much without any additional information. It’s possible that elevated troponin levels in these studies may not even relate to myocardial injury, but other physiological damages in the body that may be overlooked when the focus lies solely on finding myocarditis. Given the multitude of other adverse reactions it’s worth considering other possibilities.
Altogether, we should expect a study to do more if we are to figure out what exactly is happening with these vaccines.
Is there more to the troponin story?
In looking at the original data I was curious why no baseline troponin levels were measured, and in reality there’s a question why Day 3 measures were taken compared to other days.
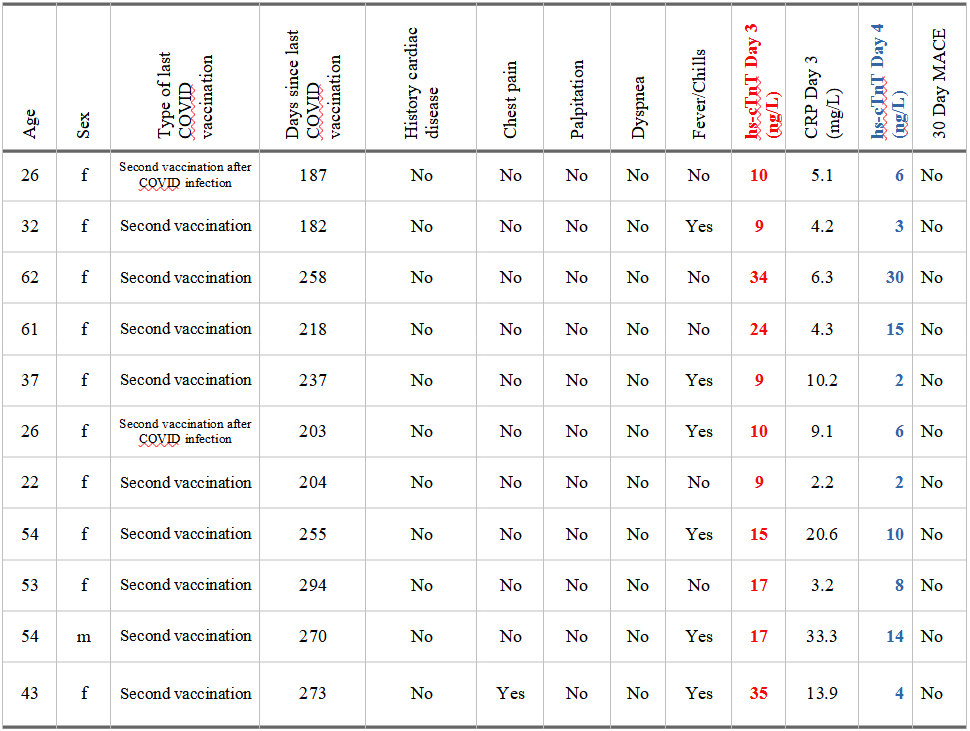
Supplemental Table 4 shows troponin levels on Day 3 (in red) and Day 4 (in blue) for employees who were excluded for possible underlying cardiovascular disease:
Note that these individuals are older, and even though they were above the ULN for women they were considered to have had prior, underlying cardiovascular disease given their age and the minimal changes in troponin levels.
This doesn’t make this number as arbitrary as I previously mentioned, but if underlying cardiovascular disease is suspected it may have been worth it for the researchers to have confirmed rather than speculate. Again, the lack of baseline data means that we don’t know if these numbers are elevations caused by the vaccines or standard values that suggest something else.
At this point I should warn that I misinterpreted some of the study design. When the authors refers to troponin levels at follow-up, they are not referring to the 30-day follow up, but rather the day immediately after, or Day 4 to be more precise. In the previous article I mentioned that they measured troponin levels on Day 30 which they did not. This, in some parts, makes the study worse since the actual surveillance was even more loose than I originally thought. It was only in the two consecutive days rather than the two days with a 1-month follow-up. If the language for the following section sounds confusing note that it’s because of this realization.
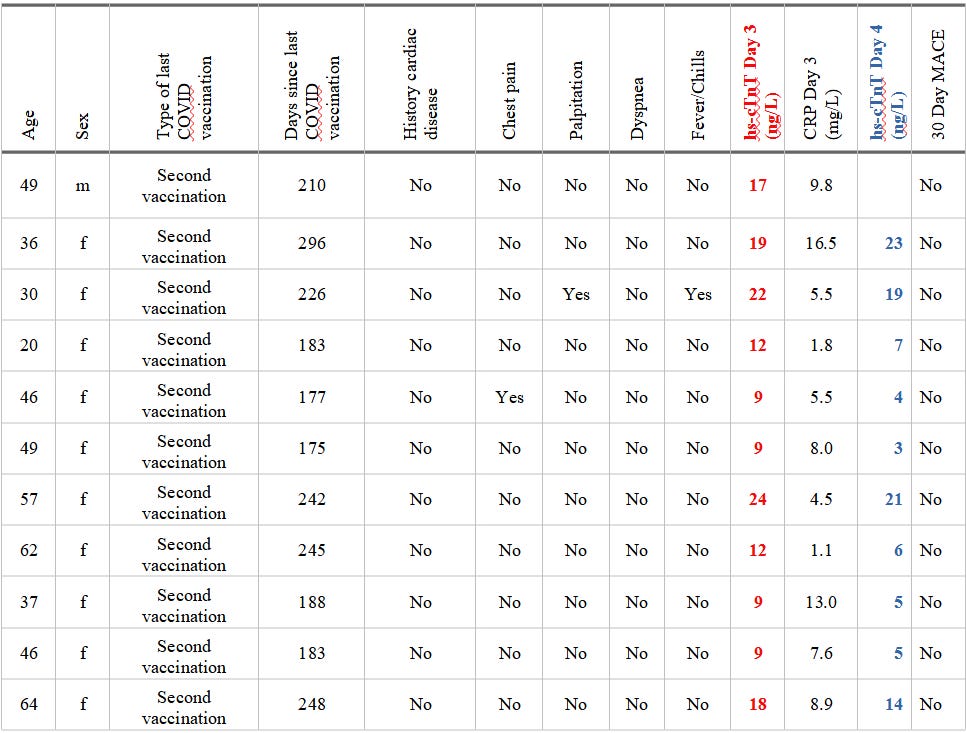
When looking at the troponin levels for Day 3 and Day 4 note the following with respect to these individuals (color-coded the same as the above table):

Note that if we use the ULN cutoff for this assay of 8.9 ng/L for females and 15.5 ng/L for males, by Day 4 13 of the 22 individuals (well, 21 since one man didn’t provide Day 4 measures) had troponin levels that fell below the ULN. Again, we can’t know if this decline is a return to baseline.
Also, the exclusions I mentioned in the prior article may not have been based on increases, but more based upon absolute changes. If the numbers “appeared” far different on Day 4 as compared to Day 3 then the values were considered to be vaccine-related based upon the researcher’s interpretations.
Note also that, albeit heterogeneous, it does appear that the older employees were the ones that showed the highest troponin levels (aside from the 36 y/o female who showed an increase on Day 4).
There’s also some data that is never explained, such as the the one woman who showed an increase (mentioned above), as well as the 62 y/o that had one of the highest troponin levels that did not seem to decrease drastically by Day 4. In contrast, the 43 y/o who showed a troponin level of 35 ng/L on Day 3 showed a sudden decrease to 4 ng/L on Day 4.
Given the realization I misinterpreted these troponin levels, I would actually consider that these results tell us something more- they tell us that troponin levels may need to be surveyed right at the onset of vaccination and in the following days to get a proper read on troponin trends within these individuals.
In that regard, a data trend may be far more critical than just data points alone.
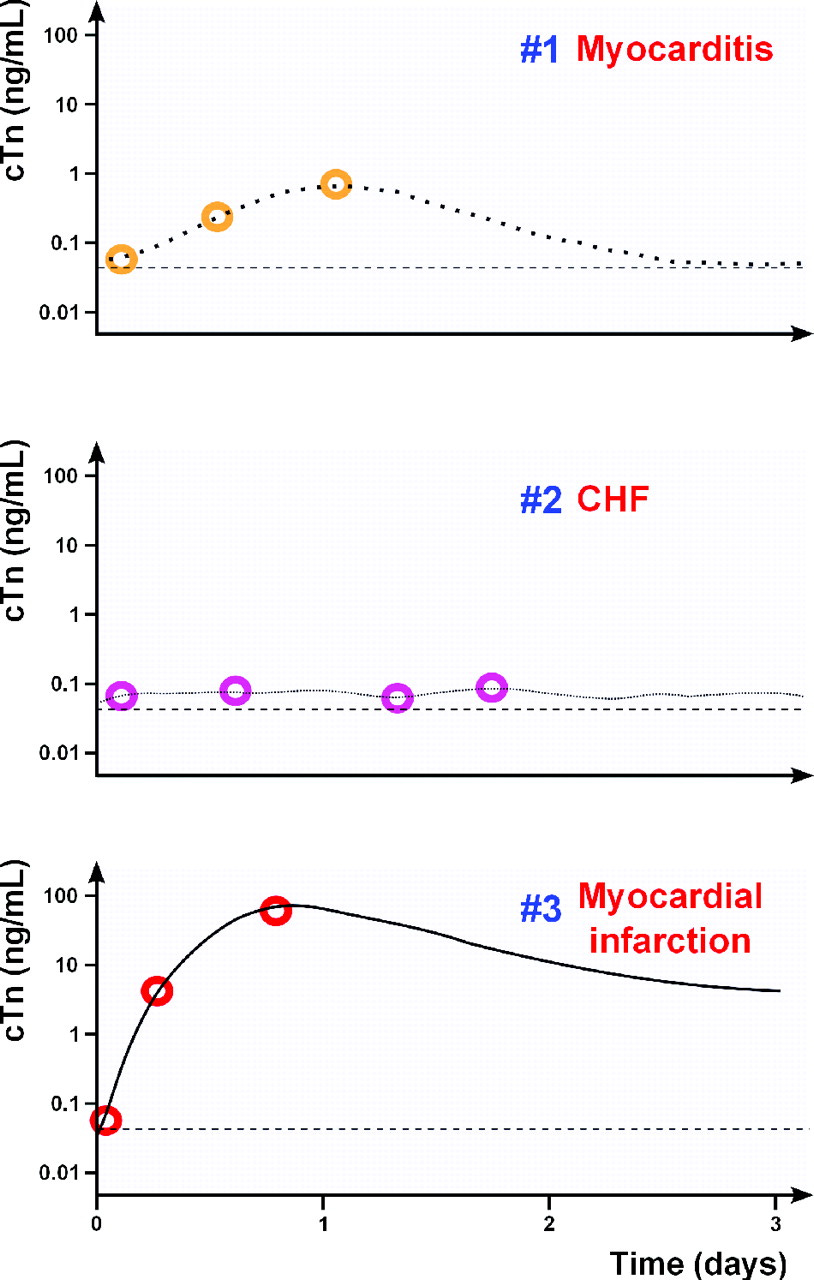
Note that in the Mahajon, V. S. & Jarolim, P.3 article they noted troponin trends in patients diagnosed with different cardiovascular diseases. This data is based on case reports, but note that in one individual with myocarditis the change in troponin levels were gradual and lower while heart attacks may see a sudden increase in troponin:

Note that this data is in ng/mL. In order to convert it into ng/L multiply these values by 1000. These values also were taken at several times within one day, suggesting that these increases in troponin may occur within a matter of hours.
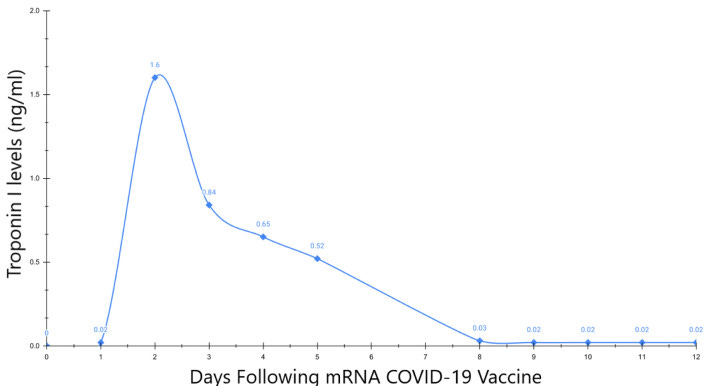
There is also this interesting case report4 I came across of a 62 y/o women who began having chest paints within hours of receiving a COVID booster:
A 63-year-old woman with a past medical history of rheumatoid arthritis and mixed connective tissue disease presented to the emergency room (ER) with new onset chest pain 11 h following a third dose of the Pfizer BioNTech coronavirus disease 2019 (COVID-19) vaccination. Her physical examination was unremarkable without the findings of pericardial rub or heart murmur.
In this case the women’s troponin levels showed a sharp spike on Day 2 which decreased within the following days.

In this case the women’s myocarditis was later confirmed with imaging on Day 11. She was prescribed colchicine and prednisone for her myocarditis rather than NSAIDs in the following weeks. By 6-month follow up the patient reported occasional chest pain which the researchers suggest are due to other etiologies, although damage from the vaccine shouldn’t be dismissed too quickly.
These two bits of information provide us with interesting context. With Buergin, et al. I have been rather quick to question these troponin values. It’s possible all of these elevated measures are indicative of possible vaccine-related myocardial injury, but the lack of context doesn’t give us much to work with aside from suppositions.
In contrast, what the above case report tells us is that it may be critical for researchers to measure troponin levels right at the onset of vaccination and be tracked for the next few days.
In this case, Buergin, et al. may have actually missed out on a critical timeframe of data collection, leading to supposition of myocardial injury rather than measures that may tell us the degree and diagnosis of myocardial injury with these individuals.
Let’s suppose that the 22 individuals from the study had a similar trajectory in their troponin levels as the case report from Aldana-Bitar, et al. By the time that troponin measures were taken on Day 3 and Day 4 it’s likely that many of these people were going to be on the decline anyways. This raises more issues given that no imaging was done later on which would confirm myocardial injury. Again, if the researchers suspected silent damage without doing proper testing then we are still left in the dark.
Overall, what this suggests is that troponin levels may be related to other adverse reactions. It’s important to consider more than just myocardial injury as the reason for troponin increase. At the same time, if myocardial injury is suspected, then surveillance studies should focus more on taking routine biomarkers, especially right at the moment of boosting and within the proceeding days. Because no baseline data was provided by Buergin, et al., as well as data on Day 1 and Day 2, there’s likely to have been critical troponin measures that were missed including the sudden increase of troponin right after vaccination. This is made even more pertinent given the onset of myocarditis within a week of vaccination.
Because of that shouldn’t it be critical to get daily troponin measures to both predict and properly diagnose myocardial injury? Given that one person mentioned chest pains while also showing a troponin level of 34 on Day 3 and 5 on Day 4, wouldn’t that be something worth investigating? Note that myocarditis was mentioned in this article, although the Buergin, et al. study may infer another form of myocardial injury (or other adverse reactions) due to the lack of elevated cytokine levels, but that may also be due to the improper timing. Since these cytokine measures were not taken early on and were not followed as well they only tell us what is going on at the time of collection.
This also emphasizes why troponin measures, as well as other findings, will provide a more clear picture of what exactly is happening. We should expect more from studies, especially if we hope to figure out what exactly is going on among the vaccine injured.
Substack is my main source of income and all support helps to support me in my daily life. If you enjoyed this post and other works please consider supporting me through a paid Substack subscription or through my Ko-fi. Any bit helps, and it encourages independent creators and journalists such as myself to provide work outside of the mainstream narrative.

Buergin, N., Lopez-Ayala, P., Hirsiger, J.R., Mueller, P., Median, D., Glarner, N., Rumora, K., Herrmann, T., Koechlin, L., Haaf, P., Rentsch, K., Battegay, M., Banderet, F., Berger, C.T. and Mueller, C. (2023), Sex-specific differences in myocardial injury incidence after COVID-19 mRNA-1273 Booster Vaccination. Eur J Heart Fail. Accepted Author Manuscript. https://doi.org/10.1002/ejhf.2978
Airaksinen K. E. J. (2020). Cardiac Troponin Release After Endurance Exercise: Still Much to Learn. Journal of the American Heart Association, 9(4), e015912. https://doi.org/10.1161/JAHA.120.015912
Mahajan, V. S., & Jarolim, P. (2011). How to interpret elevated cardiac troponin levels. Circulation, 124(21), 2350–2354. https://doi.org/10.1161/CIRCULATIONAHA.111.023697
Aldana-Bitar, J., Ramirez, N. R., Jaffe, A. S., Manubolu, V. S., Verghese, D., Hussein, L., Anderson, L. R., Budoff, M. J., & Karlsberg, R. P. (2022). Serial Changes in Troponin I in COVID-19 Vaccine-Associated Myocarditis. Cardiology research, 13(4), 250–254. https://doi.org/10.14740/cr1412


As with all things in hindsight, troponin kinetics was something I should have emphasized more.
That is, elevation and clearance of troponin should be taken into consideration when it comes to figuring out what troponin levels are actually telling us at any given time. In the same ways that several people among the suspected vaccine-injured cohort may be on the troponin decline by Day 3 or Day 4 of their blood tests, it's quite possible that several individuals may have also had a sudden elevation in troponin that lasted a day or two, in which case Day 3 measures would have missed this finding and lumped these people in with the non-elevated group if their levels happened to fall below the ULN at the time of sampling. There's a lot about the time frame that is worth scrutinizing.
Although I’m not inclined to run up healthcare cost...seems that adding “routine” Troponin levels with a variety of possible spike protein damage injuries, rather than only cardiac, but also screening other known injury sites...
Along with actual public autopsies and data...
...along with halting mRNA until transparent Independent investigations regarding efficacy and safety (including potential breakthrough contagions)