Evidence of higher reinfection among vaccinated?
Or maybe there's a bit more than what is being presented.
Right now I’ve been working on my post for NAC and clinical trials which hopefully will come out in a day or two.
I also try to peruse what else is on Substack and what else is being posted.
Today, there were quite a few people posting a JAMA study1 which, if true, would not bode well for the vaccinated.
The study in question was one study published in JAMA which looked at reinfection rates during the Omicron wave, and from the many reports that have come out it would appear that those who were vaccinated were more likely to become reinfected.
Not good! That would mean maybe something is happening with these vaccines leading to reinfections!
At least, as long as the evidence was there to support such an argument.
And here’s where we run into trouble. Not a little, but A LOT of trouble with this study.
As I’ve stated, several people have reported on this study, mostly referencing this part of the Results section with the important part bolded below:
The probability of reinfection increased with time from the initial infection (odds ratio of 18 months vs 3 months, 1.56; 95% CI, 1.18-2.08) (Figure) and was higher among persons who had received 2 or more doses compared with 1 dose or less of vaccine (odds ratio, 1.42; 95% CI, 1.13-1.78). Defining reinfection after 30 or more days or 90 or more days did not qualitatively change the results.
Again, VERY CONCERNING IF TRUE.
And this is usually where the story ends and we pontificate on what this all means and how bad the vaccines are.
BUT
Remember that there are A TON of problems with this study.
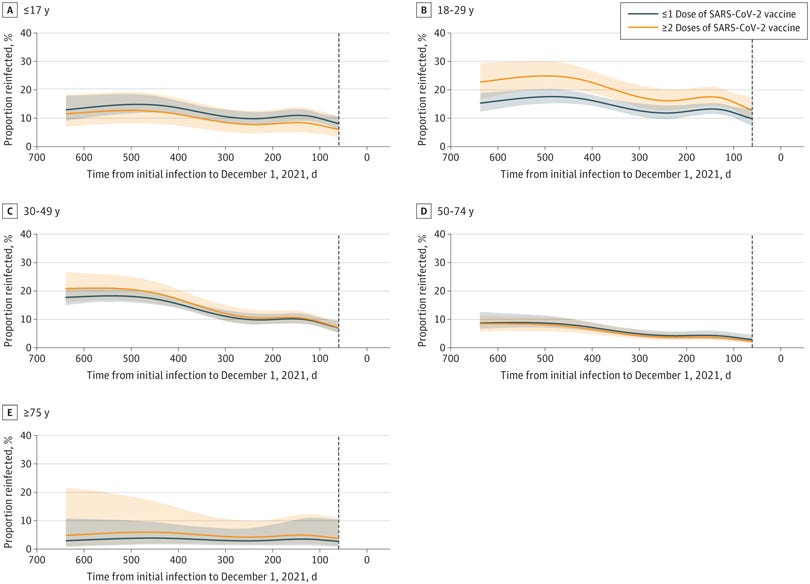
For instance, this is a reinfection study, right? That would mean that we would need to have measures on reinfections. The researchers do provide this chart, suggesting that reinfection is more likely the more time has passed since the first infection. The researchers did break up this information into different age cohorts which is pretty nice.

These charts should really be read in reverse, but essentially what it graphs are the rates of reinfection based on time since the first infection.
What we can see is that the longer it has been since the first infection the more likely one is to become reinfected. Just compare the measures on the left and on the right side of the graph. You can also see the difference between vaccinated groups, such that the orange line (those who received two doses of vaccines) and the blue line (1 or fewer- and yes, it’s fewer, not less! I shall be a grammar nazi when it comes to this!) can be contrasted to see who is being reinfected at a higher rate.
What’ you’ll note is that, for the most part, these reinfection values between vaccine groups are somewhat comparable. There are 3 groups that show higher rates of reinfection between the 2-dose group compared to the 1 or fewer dosed groups2, but only one really stands out, and that’s the 18-29 age group. Now, this assessment is rather qualitative, but remember that results can be skewed by just a few additional data points. Here, it’s likely that the argument about higher infection rates among the 2-dose vaccinated presented by the researchers are being skewed by the 18-29 group. It would be interesting to see if removal of that age group removes that statistical significance.
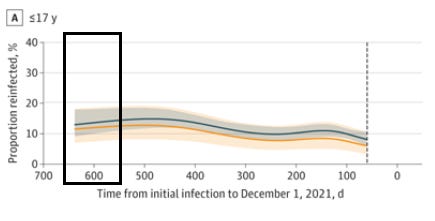
But something that’s more strange, and something I didn’t realize before when I first saw this study, was the number of days the graphs went up to. If you notice, all of the graphs go past 600 days.
Here’s an example from the <17 group:
Remember, this graph is measuring time between infections, which means that 600 days would tell us an infection gap of more than 1.5 years!
This made me even more skeptical of this information and so I went to look back at the Methods and you can see this excerpt:
This population-based cohort study monitored all persons previously infected with SARS-CoV-2 for reinfection during the Omicron wave in Iceland, which was defined from December 1, 2021 (first diagnosed case of Omicron in Iceland) to the end of the study period on February 13, 2022. Data on all SARS-CoV-2 polymerase chain reaction (PCR) test results performed in the country were obtained from Landspitali–The National University Hospital of Iceland, and data on vaccine status were obtained from the Icelandic Directorate of Health. Reinfection was defined as a positive PCR test for SARS-CoV-2 60 or more days from a previous positive test.
The first bolded phrase is important- this study wasn’t a look at reinfection during Omicron, it was a study looking at reinfection between pre-Omicron and during the Omicron wave.
I referenced a Qatar study3 that used a cohort of unvaccinated individuals and measured reinfection. Remember from that study study that those who were infected before the Omicron wave showed low protection from infection with Omicron. VERY LOW, especially the longer the time period between infections- similar to what this study was arguing (Chemaitelly, et. al.):
Effectiveness varied for the primary-infection sub-cohorts (Figure 2B). It was ∼60% for those with a more recent primary infection, between June 1, 2021 and November 30, 2021, during Delta-dominated incidence.4, 34, 35 Effectiveness declined with time since primary infection and was 17.0% (95% CI: 10.1-23.5%) for those with a primary infection between December 1, 2020 and February 28, 2021, during Alpha-dominated incidence.4, 34, 35 However, higher effectiveness of ∼50% was estimated for those with a primary infection before August 31, 2020, during original-virus incidence (note discussion in Section S3).4, 34, 35 Fitting the waning of protection to a Gompertz curve suggested that effectiveness reaches 50% in the 8th month after primary infection and <10% by the 15th month (Figure 3).
Again, this was a group of unvaccinated, infected individuals who were included in the Qatar study.
So all of this just raises questions. How the heck can one get a measure for reinfection with nearly a 600 day gap in between infections?!
To find the answer, I put on my Brian Mowrey cap and went to the Supplemental materials to find answers.
I guess I was fortunate that the only important information here was two paragraphs long, but here’s one important paragraph:
The study population included all individuals who tested positive for SARS-CoV-2 by PCR in Iceland between February 28, 2020 and December 1, 2021. Three national testing programs were implemented during the study period; targeted testing based on clinical suspicion (from February 1, 2020), open invitation population screening (from March 13, 2020) and mandatory screening at the border (from June 15, 2020). All PCR-positive persons were prospectively followed at the Covid-19 Outpatient Clinic of Landspitali-The National University Hospital of Iceland, from which the data were obtained. For the main analysis, only those who had tested positive 60 days or longer before December 1, 2021 and had not died or been reinfected prior to that time were included. Sensitivity analyses were performed using definitions of 30 days or longer and 90 days or longer from the prior infection.
So let me get this straight; this study that looked at reinfection included people who got infected at the beginning of the pandemic?! Now granted, the Qatar study did have a similar inclusion criteria, but unlike the Qatar study this Icelandic study included people who were vaccinated and infected, meaning we are dealing with plenty of confounding variables (i.e. vaccination and timing of vaccination) that have not been controlled for.
All of this begs the question- who the hell were included in this study?!!
Table 1 mentions time elapsed from initial infection4, yet the definition of reinfection, and the inclusion criteria from the supplemental data mention a previous infection5, not an initial infection.
And I haven’t even discussed the timing of vaccination relative to reinfection!
Did someone get infected with Wuhan in March 2020, get vaccinated in July 2021, then get reinfected in January 2022? Was that included as a reinfection? I’m led to believe so, and yet such a measure should be highly contested.
Or maybe someone got vaccinated in July, infected in August, then reinfected in late December but all within the same year (2021).
But the first scenario is an infection → vaccination → reinfection sandwich while the second scenario would be vaccinated → infected → reinfected. Are these cohorts supposed to be comparable? I wouldn’t consider them to be- there’s far too many things going on to even consider them comparable, but again would these two just be lumped as 2 or more vaccinated and placed based on their time between infections?
I can’t find any information on demographics, and I suppose I should just post the last meaningful paragraph from the Supplemental Material. Note that the researchers likely meant December 28, 2020 and not 2021:
Vaccination against SARS-CoV-2 in Iceland began on December 28, 2021. Initially, only nursing home residents and front-line healthcare workers were vaccinated. By June 24, 2021, Covid-19 vaccines were available free of charge to all persons aged 16 years and older, and by June 28, 2021 vaccines were additionally offered to children 12-15 years of age. All persons 16 years of age and older who had received their second vaccine dose more than 6 months before were scheduled for a booster dose between November 15 and December 8, 2021. All administered doses of SARS-CoV-2 vaccines in Iceland until December 1, 2021 were obtained from the Icelandic Directorate of Health. We defined a person’s vaccination status based on the number of vaccine doses he or she had received 14 days prior to December 1, 2021. Some combinations of age group and vaccine doses were extremely rare. Specifically, almost no persons aged 75 years and older had not received a single vaccine dose and few persons aged 17 years and younger and 18-29 years had received three or more doses. For this reason, we grouped together zero and one vaccine doses and two or more doses
Great, so not many people got one dose so we’ll just lump those people in with the unvaccinated group because why not? Same goes for the people who were boosted- let’s just lump them together with the 2-dose crowd and think that there’s nothing wrong with this!
Overall, I really have no idea what the hell is going on with this data, who goes where, or anything. I’m not exactly sure what I’m supposed to be gleaning from this study.
If my diatribe has gotten confusing, I’ll point out some of my biggest critics with this study as well as some additional points:
Like I mentioned above, only 4 people had 1 dose of the vaccine.
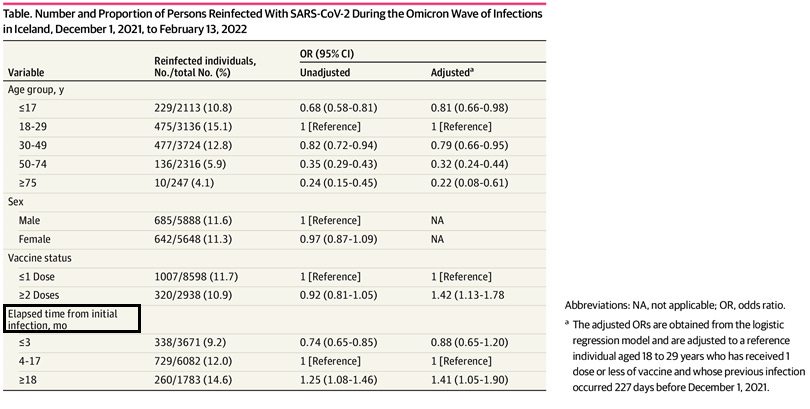
Which vaccine? Not sure, the Supplemental material doesn’t say who got what, and neither does it anywhere else in the paper even though this would be a critical piece of information. There was mention in the Results that 2942 people had at least one dose of the (which the?) vaccine. Given the number from Table 1 above that mentions 2938 people had two doses, we can assume that only 4 people had one dose. Great, 4 people- so why even include this group? Why not just get rid of them and have an “unvaccinated6” group rather than dangle that 1 or fewer group cohort?
We don’t know the order of infection and vaccination.
Which came first; the infection or the jab? Something else we are not provided, so we have no idea the sequence of events, let alone the time between each event (i.e. time between infection and vaccination or vaccination and reinfection, or even what order everything happened!)- only the time between one infection and another, and we don’t even know if what is being measured is an initial infection or a previous infection. How many people got infected with Wuhan right at the beginning of the pandemic but didn’t get reinfected until Omicron? What about Delta, or Alpha? Who got those? Nothing! We are told nothing about those variables!
Something funny with the adjusted odds ratios?
What’s interesting is that the difference between the unadjusted odds ratio and the adjusted odds ratio are slightly different for each group (look at “age group” and “elapsed time” variables from Table 1), and yet the data point that people have latched onto- the 1.42 for the 2-dose or more group is so different from the 0.92 unadjusted group. Now, I’m not savvy with statistics but what has essentially happened here is that a value of 0.92 would argue that there were higher odds of becoming reinfected among the unvaccinated group (albeit very small odds), but adjusting to 1.42 now means that odds of reinfection are higher among the vaccinated. Essentially, the odds have swapped from one group to the other group. Again, I’m not good with statistics but I would have to wonder if going from unvaccinated → vaccinated would warrant some type of skepticism about the methodology.
But what really seems strange is the reference for the adjustment:
I usually don’t pay attention to odds ratios but this seems like such a specific, niche reference point for the adjusted ratios. Even stranger, it appears that this reference was even included among the different age brackets.
Maybe someone with statistical wherewithal can explain whether this would be an appropriate adjustment, but I find it a bit too convenient for my liking to have such a stark difference in odds ratios based on this reference.
One argument I can make is that this 227 day is actually a reference to the median time for reinfection mentioned in the Results section, and so this person could have been used as a reference due to that association. Hopefully someone with more statistical knowledge can suggest if this was appropriate.
Did you read the study?
7On Friday’s post I made mention about having thoughts be your own, and having that ability to look at information and assess its merits. I made such remarks because I’m genuinely concerned that people are just taking from whatever study they can find.
I’ll provide an excerpt from that post that I find fitting:
However, there’s been quite a few things that have been weighing on me these past few months, mostly revolving around Substack and the kind of atmosphere that has been emerging.
I’ve scurried around and looked at comment sections in other people’s posts, and I’ve been rather dismayed at the sort of comments I’ve seen.
People commenting that they don’t know what they are reading (i.e. they don’t understand the science behind some posts) but know that they’re supposed to be scared based on what was presented. I’ve seen other comments from people stating that they need to lay off of Substack for their own sanity because of all of the doomer posts.
These sorts of comments always struck a nerve in me. How can people not understand what they are reading, yet understand they’re supposed to react emotionally to said posts? Shouldn’t comprehension precede reaction?
[…]
Because of this I want to say one thing- make sure that you are control of your own thoughts and mental faculties. Make sure your thoughts are your own and not something you repeat without giving them second thoughts. Be careful of falling into groupthink and following personality figures from any side- there are fear merchants everywhere that may try to prey on you by telling you that “we’re all doomed” or that this is some “final warning” before everything goes to hell.
Make sure that you have some understanding of what you are reading. And if you don’t, reach out to publishers and ask them questions. Use Substack as a place of learning rather than another social media venue to get clapbacks and likes.
Likes are ephemeral; wisdom is perennial.
I think it’s ironic that this study would be one heavily referenced today in light of my own remarks.
Given the comments I’ve seen around this study and the number of people who have posted it, I’ve wondered how many people actually read and took apart the study.
Even stranger is that this study is one of the shortest studies out there, probably only two pages- one for the text, and 1 for the figures- although the Supplemental material would bump that number up to 3.
If it hasn’t been made clear yet, I think this is a generally pointless study. It does tell us that the risk of reinfection increases the more time has passed since the prior infection, but we can't say much about the role that vaccination is playing.
Far too many confounding variables not controlled for, no information about who got what vaccine, which variant people were infected with, demographics besides age and vaccine status, and the list can just keep going on8. We really can’t tell much from this study, and from what we can tell I have some concerns as to how that adjusted odds ratio number was reached9.
But given all of this why was this study so heavily referenced? Shouldn’t other people have noticed that there’s a few holes to this study, or that it didn’t provide the full picture?
Because of this I’m rather curious and I wanted to give a poll and see who actually read this study before they commented on it. No, this isn’t meant to shame people! But I think we need more honesty and transparency here.
If anyone is concerned they may be singled out based on the poll, be aware that I have no idea how people respond- I pretty much only see what you all see from the poll results.
With that in mind, remember to do a little more digging before taking things as they are presented, and consider doing your own research.
If you enjoyed this post and other works please consider supporting me through a paid Substack subscription or through my Ko-fi. Any bit helps, and it encourages independent creators and journalists outside the mainstream.

Eythorsson E, Runolfsdottir HL, Ingvarsson RF, Sigurdsson MI, Palsson R. Rate of SARS-CoV-2 Reinfection During an Omicron Wave in Iceland. JAMA Netw Open. 2022;5(8):e2225320. doi:10.1001/jamanetworkopen.2022.25320
18-29 group, 30-49 group, and above 75.
Duration of immune protection of SARS-CoV-2 natural infection against reinfection in Qatar
Hiam Chemaitelly, Nico Nagelkerke, Houssein H. Ayoub, Peter Coyle, Patrick Tang, Hadi M. Yassine, Hebah A. Al-Khatib, Maria K. Smatti, Mohammad R. Hasan, Zaina Al-Kanaani, Einas Al-Kuwari, Andrew Jeremijenko, Anvar Hassan Kaleeckal, Ali Nizar Latif, Riyazuddin Mohammad Shaik, Hanan F. Abdul-Rahim, Gheyath K. Nasrallah, Mohamed Ghaith Al-Kuwari, Adeel A. Butt, Hamad Eid Al-Romaihi, Mohamed H. Al-Thani, Abdullatif Al-Khal, Roberto Bertollini, Laith J. Abu-Raddad
medRxiv 2022.07.06.22277306; doi: https://doi.org/10.1101/2022.07.06.22277306
The age-stratified charts also mention initial infection, so again I’m not sure what is exactly being measured here.
The interchange between previous and initial is still confusing to me. However, I initially had a rant about there possibly being people who had multiple infections being included based on the end of the first Supplemental paragraph. However, that was a misreading so I scrapped that portion. If there appears to be some inconsistency with the flow it may have been due to the removal of that section.
For the rest of the post I’m referencing the 1 or fewer vaccine dosed groups as unvaccinated.
I did write a post a few months ago asking this question but in reference to an Ivermectin study:
That includes severity of illness and prior comorbidities/illnesses.
I’m not arguing that the researchers are doing anything nefarious, but I’m just curious about the methodology being deployed here and whether it’s appropriate.
Also, if anyone believes that the reference was appropriate please let me know!


Great article! This is what we should have, an exchange of thoughts and open disagreement.
The so called "science" should give reinfections a very close look, and look at them in the context of many things, one of them being vaccination status. Unfortunately, very few of such studies are done because, probably, they are not financed by whoever wields the purse strings.
I would personally be delighted if more people were studied and the studies dissected participants along many angles better.
Your question about reinfections such as infection --> vaccination --> reinfection vs vaccination --> infection --> reinfection is a good one.
Defining reinfections using PCR tests misses two things:
- People who did not test one of their illnesses with PCR and used a rapid test, more applicable to the later time in the pandemic
- PCR tests with too high cycle thresholds can give false positive, especially if people are tested repeatedly. For example, if 1 out of 50 tests is a false positive, and some people are tested weekly, then those people will be reported "infected" once a year even if they never are ill at all.
But, sadly we have what we have. Results of this study agree with what many of us observe, UKHSA case rates when they were published, etc
Right out of author’s mouth:
This finding should be interpreted with caution because of limitations of our study, which include the inability to adjust for the complex relationships among prior infection, vaccine eligibility, and underlying conditions.
Thanks for interpreting with caution, cause I’ve seen quite a few who did not. A very underwhelming study. And quite frankly a useless attempt at science- are there no great thinkers left? Why are such basic questions left unanswered?